New Data Dashboard Helps Cities Build Urban Resilience in a Changing Climate
Developed by UrbanShift and Cities4Forests, this new tool enables local actors to assess real-time climate risks and effectively plan future mitigation strategies.
Source: UrbanShift and Cities4Forests Cities Indicators Dashboard, "Biodiversity" theme
Climate change is impacting cities and their residents in many profound ways, from poor air quality to flooding, biodiversity loss and extreme heat. Now, with the help of a new tool, a select number of cities from around the world have localized and integrated data to help build resilience to climate change and secure a more sustainable and nature-positive future.
The new geospatial indicator dashboard from the UrbanShift and Cities4Forests global initiatives helps cities visualize the connections between climate change and the urban environment through various sustainability metrics. This new tool is available for 23 UrbanShift cities and 12 Cities4Forests cities.
The dashboard includes data for seven key themes that impact the health and wellbeing of city residents, such as air quality, flooding and greenhouse gas emissions. For each theme, the dashboard provides multiple indicators that describe current baselines, recent trends, or projected changes related to environmental assets or risks and their impacts, both citywide and for specific neighborhoods. This information can help cities better understand the factors influencing their assets and risks levels; prioritize and prepare for hazards; set goals; or implement targeted strategies to enhance assets or mitigate impacts.
Below, we explore city-specific examples to show what kinds of insights can be gleaned from the dashboard across each of the seven themes.
1. Extreme Heat
Extreme heat kills an average of 489,000 people around the world annually, making it the single deadliest natural disaster in most years. And, due to the urban heat island effect, cities and their residents are exposed to greater heat hazard than nearby rural areas. Climate change is expected to further exacerbate this risk to city residents.
Of all cities analyzed using the dashboard’s data, Barranquilla, Colombia is forecasted to have the greatest overall increase in extreme heat hazard between 2020 and 2050. However, localized heat mapping shows that compared to other cities assessed, it has fewer neighborhoods with heat hazard levels significantly above the city average. This may be due in part to the broad distribution of public parks and open spaces across the city, which were greatly expanded over the last decade through its award-winning Todos al Parque program.
Heat risk indicators in Barranquilla, Colombia

Still, mapping shows that certain neighborhoods within the city, such as Pumarejo and Los Jobos, have relatively high land surface temperatures. These neighborhoods also have lower surface reflectivity and tree cover, both of which contribute to local heat islands. Barranquilla and cities like it could use this data to implement targeted solutions — such as increased tree cover and reflectivity of built surfaces like roofs and streets — to help decrease extreme heat exposure in at-risk areas.
2. Air Pollution
Air pollution is a significant health risk in cities. Worldwide, 9 out of 10 people breathe polluted ambient air, leading to more than 4 million premature deaths each year. And deaths from air pollution are on the rise in many of world’s fastest-growing countries.
The dashboard shows that in Addis Ababa, Ethiopia, a rapidly growing megacity, all but two days in 2020 exceeded the World Health Organization’s recommended maximum levels of air pollution. Fine particulate matter, which has serious health effects, was especially prevalent. The city estimates that poor air quality caused 2,700 premature deaths in 2017 and projects that number could grow to 6,000 by 2025.
High air pollution days in Addis Ababa, Ethiopia

So, what are the causes of Addis Ababa’s air pollution? Dashboard data suggest a very large increase from 2000 to 2020 in industrial emissions, particularly volatile organic compounds, black carbon, carbon monoxide and ammonia. Additional studies confirm that industry is a major potential source of this pollution while also identifying road traffic, the burning of biomass-based fuels for cooking and heating, and the open burning of waste as major contributors.
Sources of air pollution in Addis Ababa, Ethiopia

By cross-referencing the dashboard data with other research (in conjunction with the guidance of targeted programs such as the Clean Air Catalyst), Addis Ababa and other cities can prioritize research questions and further data collection; design monitoring approaches to better understand air quality problems; and help officials consider new policies and regulatory enforcement which target high-emitting sectors and activities.
3. Greenspace Access
Access to urban greenspace provides a suite of mental and physical health benefits to city residents, including enhanced developmental health in children, reduced rates of crime and improved community cohesion. To promote equal access to these benefits, the World Health Organization recommends that urban residents should be able to access public greenspaces within around a five minute walk of their homes. Other researchers have posited the “3-30-300” standard, where every resident can see 3 trees, lives in a 30% green-covered neighborhood and is within 300 meters of a park. But despite this, greenspace is often not equitably distributed in cities, with wealthier areas often enjoying better access to high-quality greenspaces than low-income areas.
To better assess greenspace accessibility, the dashboard measures not only the total amount of public open space within a city but also its proximity to where residents live. For example, data for Florianopolis, Brazil shows that, among the 23 UrbanShift cities, it boasts the highest share of urban land that is open space for public use. In addition, 79%, or nearly 8 in 10 people, have access to public open space within a 400-meter walk (or five to eight minutes) of their homes.
Insights like this can help cities promote equitable access to greenspace for their residents. By understanding where publicly accessible greenspaces are located relative to where people live, cities can prioritize efforts to build new public spaces or revitalize existing ones in underserved areas.
4. Urban Flooding
The prevalence of urban flooding is increasing globally as a result of sea level rise as well as extreme and irregular rainfall fueled by climate change. The way city infrastructure is designed can exacerbate or mitigate the problem: Impervious surfaces — buildings, pavement and other artificial structures — prevent water infiltration and increase runoff and localized flooding. Minimizing impervious surfaces through intentional greening and nature-based solutions, on the other hand, can enable cities to “sponge” up excess water, decrease flooding and protect groundwater resources.
In Salvador, Brazil, the dashboard shows that over 35% of the city’s total built-land area is impervious surface. Salvador faces challenges infiltrating excess stormwater into its soil, and extreme precipitation increasingly causes catastrophic flooding events which can displace thousands of residents at a time. Data show that certain districts, such as Mares and Caminho de Areia, contain over 90% impervious surface as well as a high percentage of total built-land areas without vegetation cover; these districts are especially vulnerable to urban flooding.
Such insights can help cities like Salvador implement targeted, data-driven, nature-based solutions to absorb excess water and enhance flooding resilience. In 2022, Cities4Forests and partners inaugurated Salvador’s first-ever rain garden to pilot this type of integrated nature-based solution. Projects like these promote sustainable rainwater drainage, reduce flooding, filter water and recharge local water tables, with multiple co-benefits for people and biodiversity.
5. City-level Greenhouse Gas Emissions
Human emissions of greenhouse gases (GHGs) are the primary drivers of climate change and constitute one of the world’s most pressing climate challenges. Calculating GHG emissions at the city level provides local decision-makers with a clear understanding of the sources and magnitude of emissions, enabling targeted interventions to reduce them and achieve climate goals.
For example, the dashboard shows that the city of Ushuaia, Argentina has experienced a significant reduction in total GHG emissions, which dropped 21% between 2000 and 2020. This was mostly due to a 54% reduction in methane emissions (mainly related to fugitive emissions). However, analyzing the data by greenhouse gas shows that this overall downward trend was not universal between pollutants. While total GHG emissions fell, carbon dioxide emissions increased by 35% between 2000 and 2020. This was mainly due to higher emissions from the transportation and residential sectors.
Sources of greenhouse gas emissions in Ushuaia, Argentina

When corroborated by local data, such findings can support policymakers in developing, monitoring and assessing the impact of emissions reduction measures — particularly those that target specific sectors or pollutants.
6. Biodiversity
The importance of biodiversity for resilience to climate change is gaining traction with governments worldwide. Protecting and enhancing biodiversity can provide urban residents with better, more reliable and more sustainable ecosystem services such as carbon sequestration, soil regulation and water management. Natural areas in cities are important for supporting this biodiversity as they provide habitat for wildlife and plants. But urban development and pollution have consumed many urban natural areas, putting the species that rely on them at risk.
To help assess the impacts of urban development on biodiversity, the dashboard measures both the total amount of natural area in a city and how well connected these natural areas are to each other. Connectivity is known to benefit biodiversity by allowing wildlife to move and disperse into and between different areas.
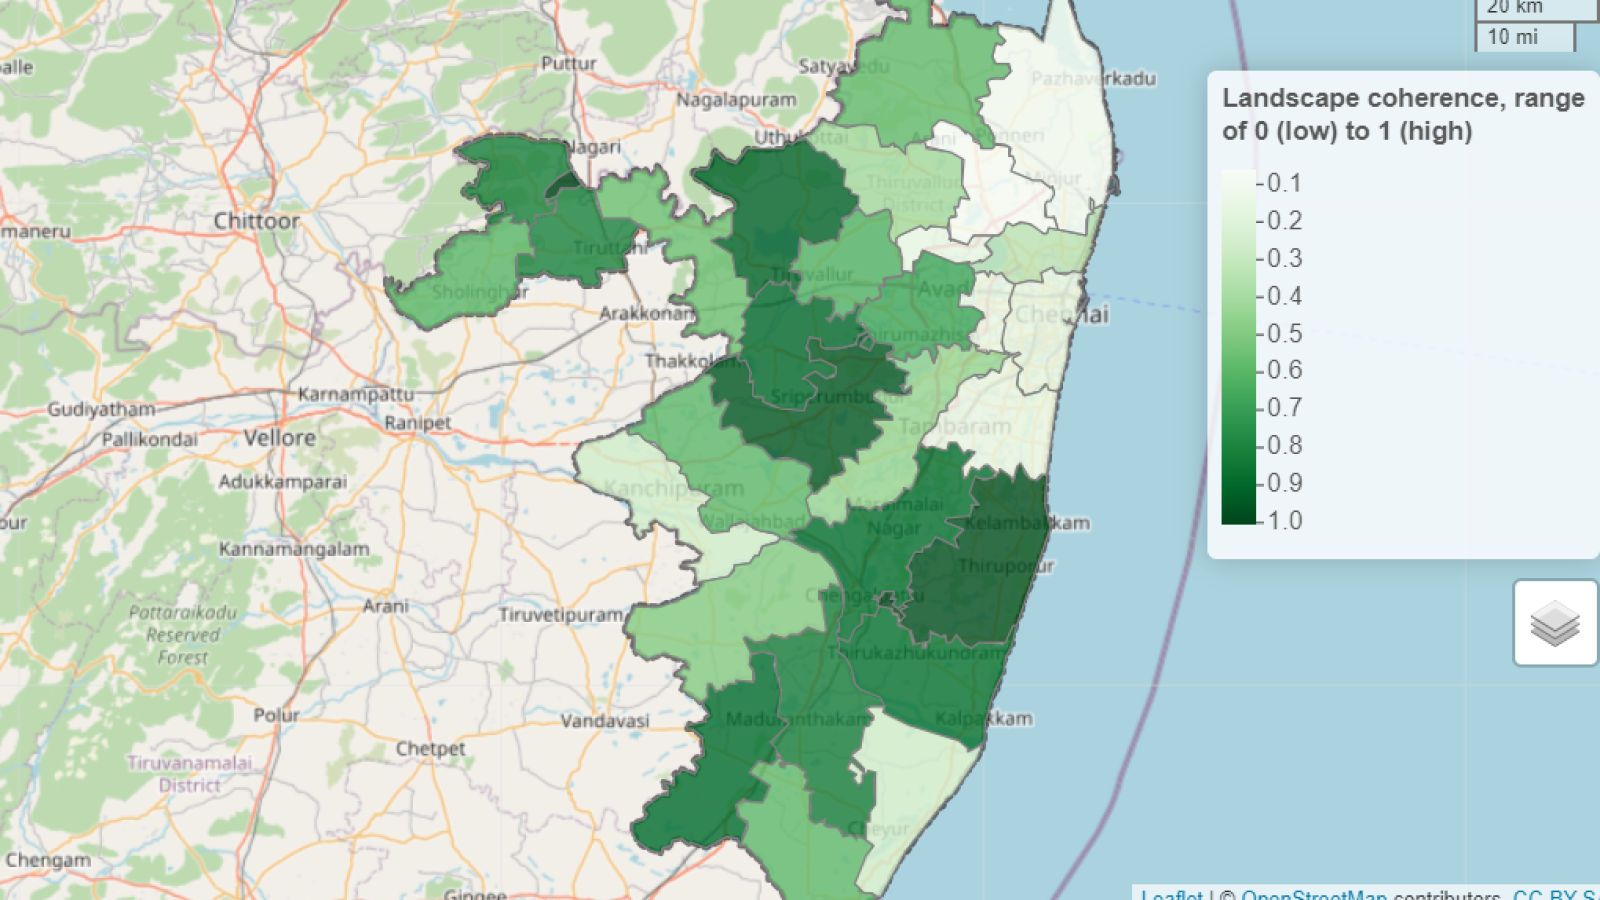
For example, Chennai — a megacity in India home to more than 11 million people — has the seventh lowest total amount of natural areas among the cohort of 23 UrbanShift cities. However, when compared to these other cities, Chennai has the 10th highest level of “landscape coherence.” This suggests that despite the relatively low proportion of natural areas in the city, those that do exist are well connected and may support higher levels of biodiversity.
Connectivity of natural areas in Chennai, India

These insights can help cities like Chennai protect existing biodiverse areas and prioritize increasing connectivity, both when restoring existing natural areas and establishing new ones.
7. Land Protection and Restoration
Natural lands both near and within cities provide essential services to their residents, such as cleaning the air and water, reducing the risk of floods and providing outdoor recreation opportunities. However, these natural lands are threatened by rapid land-use change. Every one of the 35 cities included in the dashboard saw loss of vegetated lands over the past 20 years to buildings and pavement.
Monitoring cropland can offer key insights into land-use changes because cropland is a critical transitional state for natural lands — both in its creation from nature and its loss to development. This can be seen in the dashboard data for a section of Kigali, Rwanda, which shows that all land lost to development between 2000 and 2020 was once classified as either cropland or short vegetation.
Land-use changes in Kigali, Rwanda

This kind of data can provide insight into where natural lands are being lost to development and inform decision-makers in their efforts to curb land-use change. This can include taking steps to improve agricultural yields and reduce food waste to avoid converting more natural areas to farmland. Existing projects in Rwanda and Brazil, for example, help farmers increase productivity and implement climate-smart farming practices (such as agroforestry) that can improve economic returns for farmers while reducing incentives to sell cropland to developers.
Cities Can Leverage This Data to Improve Quality of Life and Build Climate Resilience
With this new dashboard, city leaders across the world can visualize critical data on how climate change is impacting urban environments and the people who live in them. The data can help inform priorities for integrated city planning, urban development, land restoration and biodiversity protection, and more. This will help decision-makers re-design and develop existing parts of their cities to provide more sustainable and equitable livelihood opportunities, and responsibly expand their cities in the most nature-sensitive ways possible.
Consistent monitoring and tracking are critical to building effective solutions and sustaining them long-term. That’s why UrbanShift and Cities4Forests will be updating the dashboard with the latest available data for each indicator, ensuring that cities have the right data to take the best actions possible. Now, it’s up to city leaders to act on the information at hand.
Explore the UrbanShift and Cities4Forests geospatial indicators dashboard here.

Building Capacity to Assess Urban Climate Hazards and Tackle Heat and Flooding in Cities
These three interconnected courses are designed to build the capacity of city officials and urban practitioners to conduct vulnerability assessments.

Meet CityMetrics: An Open-Source, Interactive Tool for Analyzing Urban Risks and Opportunities
With CityMetrics, a new geospatial data platform developed by WRI, over 60 cities--including all 23 UrbanShift cities--can access in-depth data on urban risks and vulnerabilities.

UrbanShift at COP30
UrbanShift will be participating in a range of events during the Local Leaders Forum in Rio and COP30 in Belém. Learn more here.

Climate Resilient Cities: Assessing Differential Vulnerability to Climate Hazards in Urban India
The report highlights the need to integrate equity into climate action planning in Indian cities. It examines how socioeconomic inequality and marginalization shape climate risks.

